Nir’s Note: This guest post is by Gibson Biddle, former VP at Netflix and CPO at Chegg. Gibson is speaking at the Habit Summit in San Francisco on April 11th.
In 2005, as I joined Netflix as VP of Product, I asked Reed Hastings, the CEO, what he hoped his legacy would be. His answer: “Consumer science.” He explained, “Leaders like Steve Jobs have a sense of style and what customers seek, but I don’t. We need consumer science to get there.”
Reed’s aspiration was that the Netflix team would discover what delights customers through the scientific process — forming hypotheses through existing data, qualitative, and surveys, and then A/B testing these ideas to see what works. His vision was that product leaders at Netflix would develop remarkable consumer insight, fueled by results and learning from thousands of experiments.
During my time at Netflix, and later at my next startup, Chegg, I learned to move from customer focus to customer obsession and to embrace Reed’s notion of consumer science. Here’s how I think about the transition:
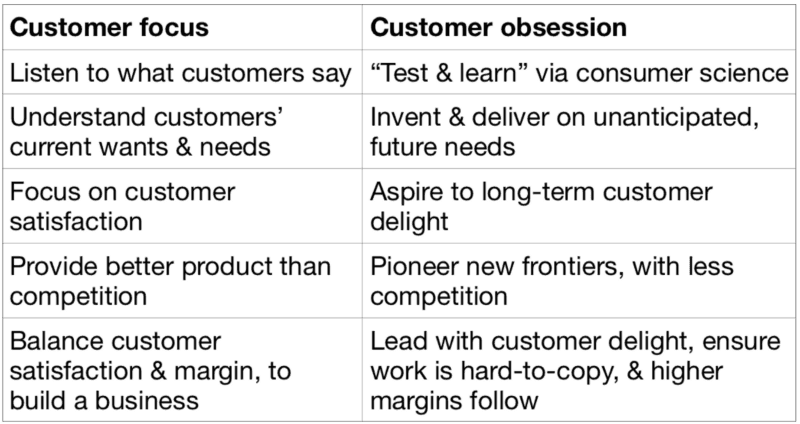
Over the years, my focus shifted from “What do customers say?” to the “Let’s test it!” mentality of consumer science. My team’s consumer insight improved, learning accelerated, and we developed stronger hypotheses about what would delight customers.
Here are the research techniques we used and how they contributed to both consumer science and customer obsession:
- We used existing data to understand past and current behavior.
- We did qualitative — focus groups, one-on-ones, usability — to hear how people think and react to our work.
- We executed surveys to capture who the customer is and how to think about them — by demographics, by competitive product usage, entertainment preferences, etc.
- Then we A/B tested the hypotheses formed via the above inputs to see what worked.
For me, customer obsession means a healthy preoccupation with customers’ unanticipated, future needs through a mix of research techniques that put the customer in the center of everything you do, so that you begin to see the product through their eyes. I found that consumer science — the scientific method of forming hypotheses, then testing them — is the best way to build a culture of customer obsession and to discover what delights customers in hard-to-copy, margin-enhancing ways.

My introduction to Netflix’s data-driven approach began with a Monday morning e-staff meeting where we looked at “e-staff metrics.” Fifteen executives sat in the room, sifting through data, asking questions. The metrics measured retention, revenue, and cost, but just as important, customer behavior changes. We kept a keen eye on the metrics and looked for unexplained changes.
In the spring of 2005, the metrics showed a sudden increase in monthly cancel rate. Teams sprang into action to discover the reason. Here’s a simplified facsimile of the data:
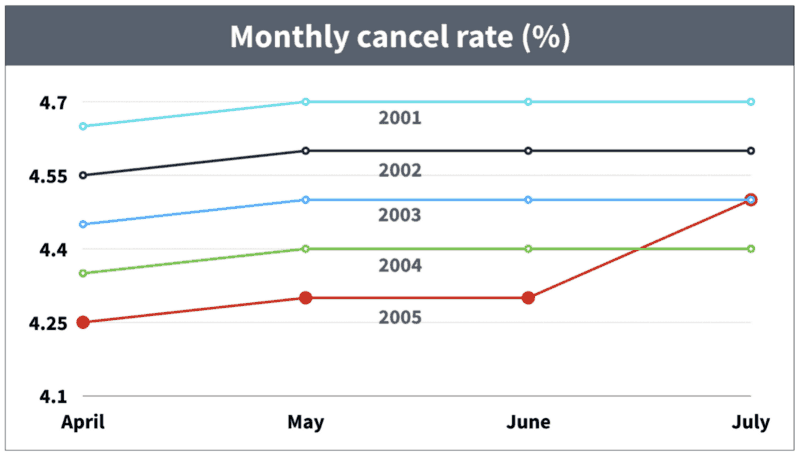
Note the red line, moving up after June — a surprise increase in cancel rate in June of 2005.
The rise in cancels motivated a fast-paced search to discover what had happened. Was it a data error? Had we implemented a site change with unintended consequences?
After digging in the data, the lead hypothesis was that members canceled as summer approached: they wanted to spend more time outside. But why hadn’t we seen this increase in the past? Was the weather better this year? (No.) Were we reaching a cancel rate plateau? (Unlikely.) I recall being impressed by the increasing number of analysts we threw against the problem — the team’s intellectual curiosity was insatiable.
We solved the mystery the next month. In hindsight, it seems simple, but in the “fog of war” it took a while to bring the issue into focus. In late spring, in each of the past four years, we had lowered prices. This obscured an annual cancel rate increase due to summer weather. 2005 was the first year we had not lowered our price as summer approached.
This exploration of cancel rates helped form a new hypothesis about how to improve retention. While looking at regional data, we noticed a surprisingly fast improvement in cancel rates in Hawaii. Below, I loosely recreate the data for Hawaii, San Jose, and Boise:
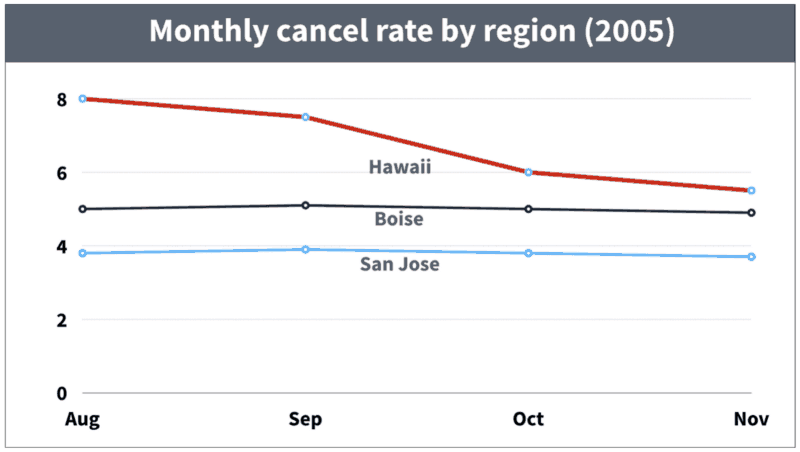
The cancel rate in Hawaii drops quickly — why?
The lowest cancel rate (San Jose) made sense as we had launched the service there first. Boise had launched a few years later and its cancel rate was slowly approaching San Jose’s rate. The surprise was the rate of improvement in Hawaii. Why had it dropped from 8% to less than 6% in less than two months?
The answer was simple. When we first offered the service in Hawaii, we shipped disks from our Los Angeles hub, and the DVDs took three days to arrive. In August, however, we launched a new DVD-by-mail hub in Honolulu. Disk delivery speed improved from three days to overnight and led to lower cancel rates.
We formed a new hypothesis: “Increasing the rate of DVD shipment speed will improve retention.” We also added a new metric to the e-staff metrics: “The percentage of DVDs delivered the next day.” Over the next few years, our operations team expanded our automated DVD delivery system from twenty hubs to the equivalent of one hundred. We also tied our inventory system to the website’s merchandising system and only displayed titles on a member’s site if the DVD was available to ship the next day from that member’s local hub.
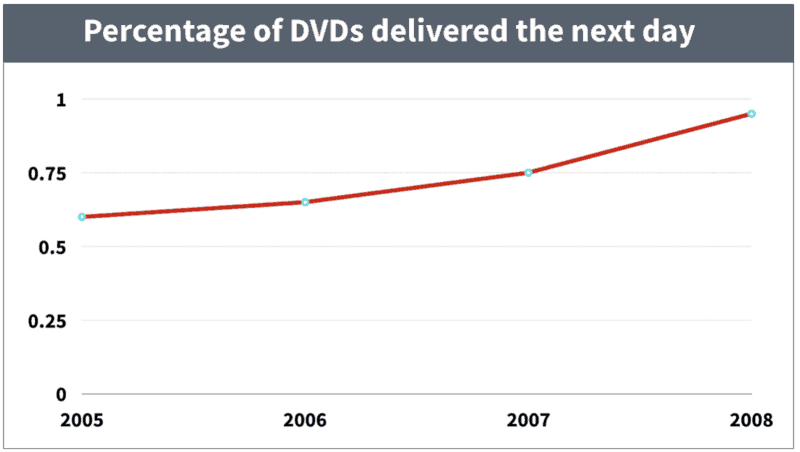
The percentage of DVDs delivered the next day, grew to 95% as the total number of hubs grew to 100.
The Hawaii data led us to nation-wide delight through faster DVD delivery. Even better, the expansion of automated operations centers throughout the country improved margin, and the delivery system was extremely hard for Blockbuster to copy. Faster DVD delivery speed achieved the trifecta of delighting customers in hard-to-copy, margin-enhancing ways.

Qualitative Research: Focus groups, one-on-ones, and usability
My first year at Netflix presented another challenge. Reed was an aggressive advocate of the hypothesis that unique movie-finding tools would improve retention by helping customers find movies they love. These tools would also improve margin by merchandising titles with lower licensing fees.
In one previews prototype, members arrived at their homepage, and video previews would automatically begin to play. In another, there was a large play button on the movie display page that members clicked to start a preview.
An example of one of the test cells for the Previews Test
We explored different prototypes in focus groups, but customers were wary. They indicated that the main reason they watched previews was because they were at the theater early to get a good seat — they were a captive audience. Other customers felt that previews revealed too much about the movie.
Reed and I talked about these issues, but he did not want to make a decision based on qualitative. The focus groups were composed of a small audience that were likely not representative of our national audience.
We executed the A/B test, and “Previews” did not improve retention, margin, or other proxy metrics. I was glad, however, I had done the qualitative as I understood the reason for the test’s failure — customers felt previews were a necessary evil. And when team members worried that the test had failed due to poor execution, I reported that the usability was excellent, based on many one-on-one user sessions.
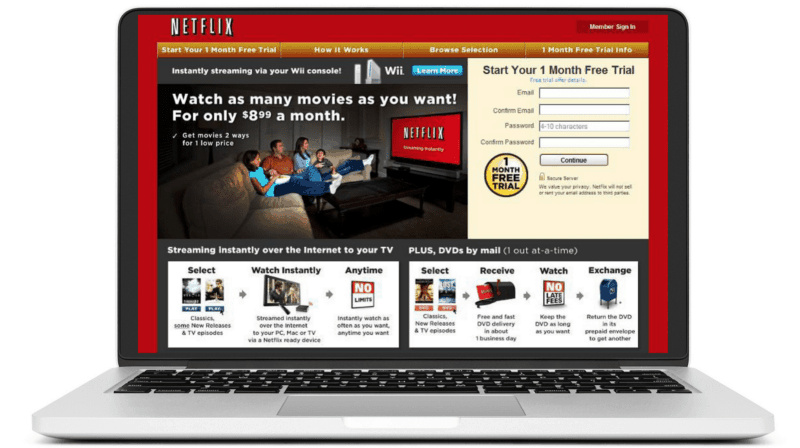
One area where I found qualitative to be especially helpful was in optimizing our non-member page — the “front door” of our site. For years, Netflix explored a variety of approaches — changes in visuals, language and interactive design — to inspire customers to begin a free trial. Every month we organized focus groups, usability, and one-on-ones around the country.

The Netflix non-member site (2006)
The focus groups helped us mitigate our “curse of knowledge.” By this, I mean that we knew our product so well that it was hard for us to think like normal customers. For instance, we scratched our heads contemplating how to lower prices from $22/month to $15/month. The insight: unlike “movie freaks” at Netflix, customers only needed one or two DVDs to choose from when they sat down to watch a movie. Thus the $9 and $15 one and two-disks-at-a-time plans were tested, succeeded, and launched to all.
There was also nuance around language and visuals that we could only evaluate via qualitative. Some examples:
- In the early years, the most effective way to position ourselves against Blockbuster was through the phrase, “No Late Fees.”
- The “happy family on a couch” communicated compelling emotional benefits.
- In the early digital delivery days, the word “streaming” did not exist and was misunderstood as “streamlining” — a bad thing. We used the phrase “Watch Instantly” to describe our nascent service until “streaming” was broadly understood.
All of these insights were formed in qualitative, then tested and affirmed in A/B tests.
We learned to organize focus groups around the country, and as a team, we listened carefully, learned from our customers and slowly shed our Silicon Valley “freakdom.” The result was a product team that had a much stronger “voice of the customer” in their heads.
Survey data
When I joined Netflix, I was wary of surveys. I recognized that what customers say is often different from how they behave. Nonetheless, I found three types of surveys helpful at Netflix:
- Demographic survey. It’s good to know who your customers are — we were often surprised.
- Cancel survey. When customers canceled, we asked them why they left. This gave us a trend line — if an issue spiked over time, we would address it quickly.
- Sample data. As our customer base grew, we used surveys to assess the quality of key attributes like DVD delivery speed and streaming quality. We enlisted our members as testers, enabling us to ship features sooner, then responded quickly if issues came up.
- Net Promoter Score. This is a proxy for overall product quality, and while Netflix had much more meaningful retention data, I found it to be a reasonable proxy for product quality and it’s easy to execute. In working with other companies, I am hopeful if the NPS score is above 50, and get excited as NPS climbs into the 70’s. (In the past, Netflix had an NPS that was close to 80.)
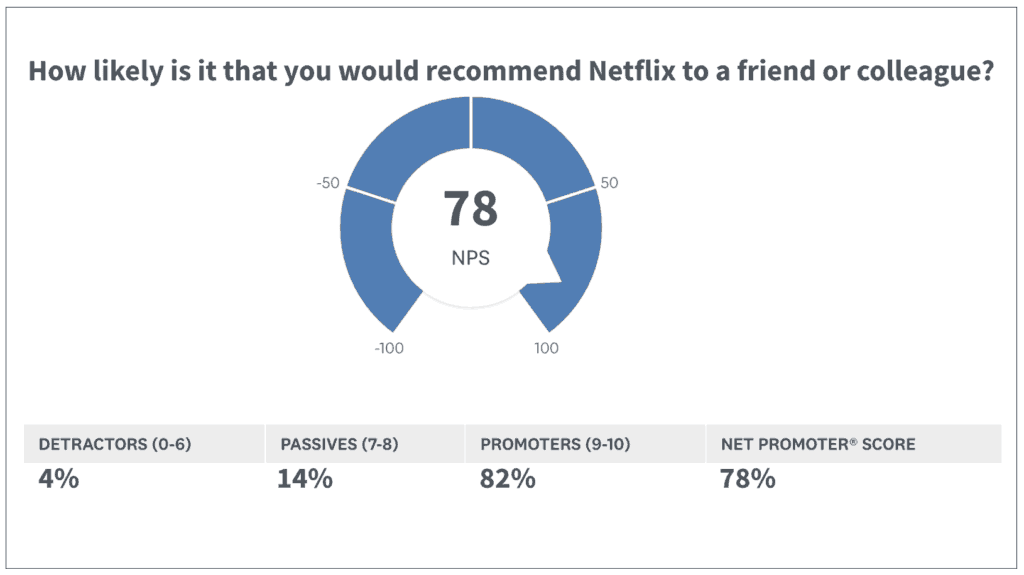
A reasonable guess at today’s Net Promoter Score for Netflix.
For startups who don’t have the resources or scale to execute A/B tests, and for fast-growing companies who need scalable ways to stay in touch with customers, surveys are a helpful part of the consumer research mix.

At Netflix, good ideas came from everywhere — via existing data, qualitative, survey data, and past A/B test results. But A/B testing was the one technique we used to see if we could change customer behavior and to measure the balance of delight v. margin.
I was introduced to this balancing act via the results of a “perfect new release test.” When I joined Netflix the top request from members was to “make it faster and easier to get new releases.” In response, Netflix created a test cell where members got new releases the day after they added them to the top of their queue. Members in the control cell had to wait days or weeks for a new release DVD.
The test result: a very small improvement in retention, but the incremental cost of the improved service was high, requiring millions of dollars to buy expensive new release inventory. In this case, the improved service cost far outweighed the benefit of delight. Put another way, customers didn’t value the improvement enough to justify the larger investment in inventory.
We had a formula that helped define this balancing act. We were willing to spend up to $200 for each “saved customer,” or twice the lifetime value of a customer. The 2x “word-of-mouth” factor was our way of encouraging product leaders to double down on delight. The rationale was that not only would an improvement cause one customer to retain, but that customer would rave about the service, bringing another customer to the service for free.
Many of the A/B test results were non-intuitive. In building the site and TV-based experience, we repeatedly found that simple trumps complete. But there was a notable exception: our non-member site. Every six months we A/B tested a simpler non-member experience but the more complicated control kept winning. Our theory: strong value messages improve conversion, and one way to communicate value is to put lots of “stuff” on the page.
The Netflix site in 2010. Still not simple — more “stuff” communicates more value.
Finally, in 2013, the simple non-member page won. By this time, the Netflix brand had grown in meaning and communicated the value of the service on its own. Today, you see a substantially simpler non-member site:
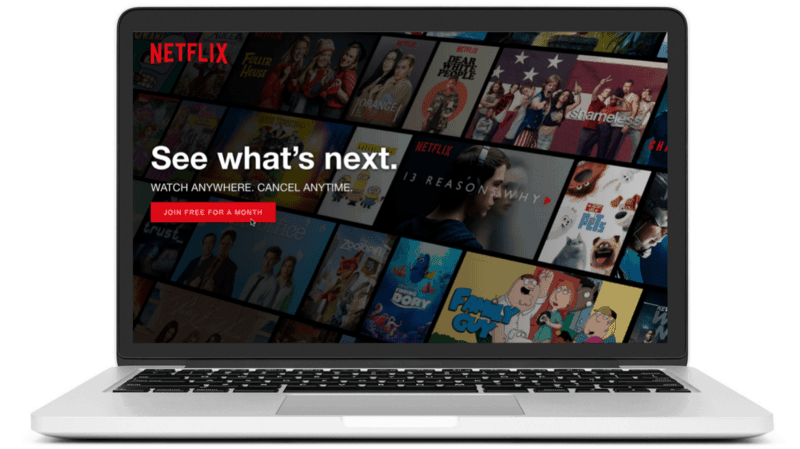
Today’s Netflix non-member site is very simple. It took 15 years, but the brand now communicates substantial value.
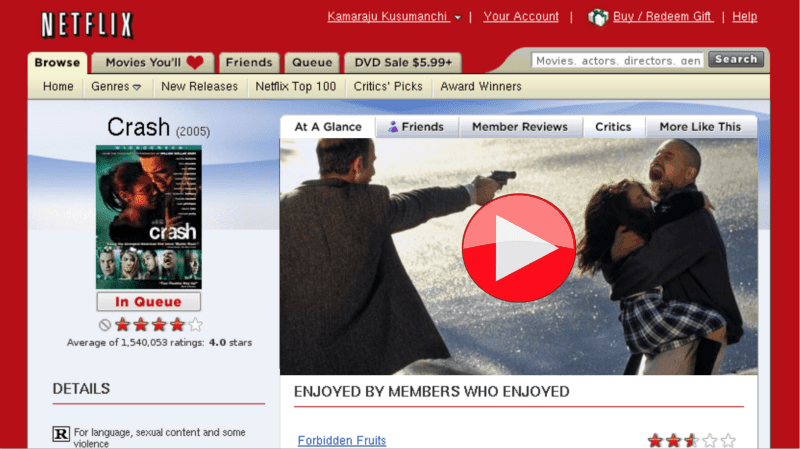
Another recent insight via A/B testing: In the past year, Netflix switched from a five-star rating system to a simpler “thumbs up, thumbs down” rating system. While members grumbled about the change, the new system doubled the number of ratings.
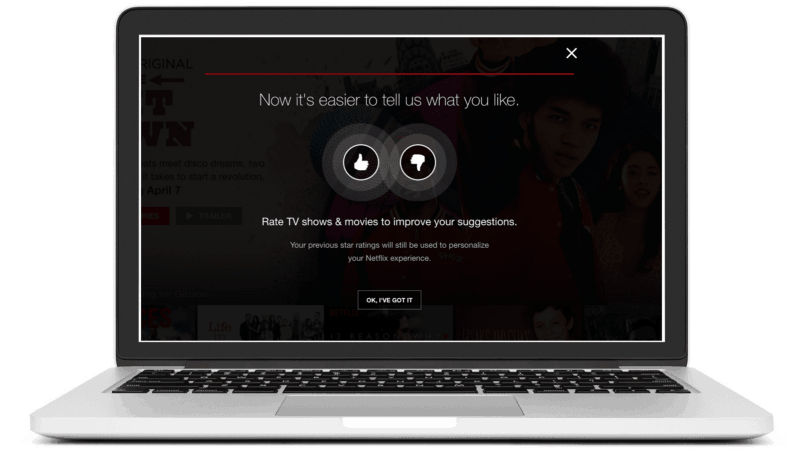
Netflix tested thumbs against stars. Thumbs doubled the number of ratings.
There’s another consumer insight hiding in this result. If you look carefully at the movie display page for a movie, there are no stars, but instead an indication of the likelihood you’ll enjoy a movie — the “percentage match.”
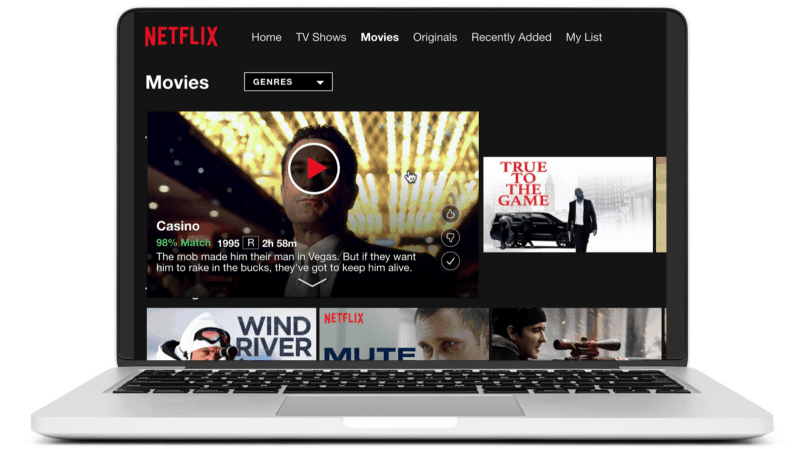
Look closely at the “98% Match” for Casino — there’s no longer a star rating for each movie.
There’s a lot of consumer insight behind this outcome, which Netflix learned through a combination of existing data, qualitative and A/B testing:
- The original hypothesis was that the more high-quality movies members watched (as measured by high star average) the better they would retain. This notion was consistent with what customers said in qualitative. Unfortunately, the data did not prove this out. Over time, higher average ratings for members did not lead to higher retention.
- In shifting to “percentage match,” Netflix acknowledged that while you may rate a “leave your brains at the door” Adam Sandler comedy only three stars, you enjoy watching it. And as much as you feel good about watching “Schindler’s List,” and give it five stars, it doesn’t increase your overall enjoyment. (The movie is a bit of a downer.)
Through a combination of analyzing existing data, what customers say in qualitative, and A/B test results, Netflix shifted from stars to thumbs, along with a percentage likelihood you’ll “match” a movie, irrespective of “star quality.”
This ten year shift, from stars to “percentage match,” illustrates the key to creating a customer-obsessed culture: dedication to the experimental method, using a mix of all four research techniques. And, like faster DVD delivery, Netflix’s personalization technology hits the “trifecta.” It delights customers with great movie choices, is very hard-to-copy (Netflix understands the movie tastes of 120M member worldwide), and improves margin (by merchandising movies that cost less).
Why use all four research techniques? Each tactic has its own blind spots. For instance, existing data describes what’s happening today, but not in the future. And customers nicely “lie” in both qualitative and surveys (“I’d never watch Adam Sandler!,” and there are lots of things you can’t A/B test. (Think about Netflix’s failed attempt to spin out its DVD business via “Qwikster” — it wasn’t testable.)
Below, I’ve done my best to outline the strengths and weaknesses of each approach. (Green is good, red is bad):
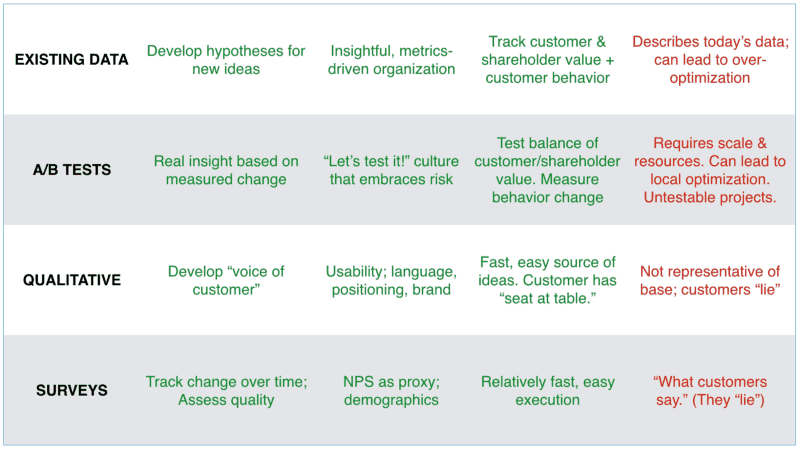
Summary of strengths (green) and weaknesses (red) of each research technique.
As a “consumer scientist,” you have a range of research techniques at your fingertips, and the formation, testing, and analysis of each hypothesis requires a mix of techniques.

The key to creating a customer-obsessed culture is to embrace consumer science and to engage in high cadence testing to learn quickly through both success and failure.
Here’s my checklist for your organization:
- Does your company have a well-developed set of “e-staff metrics” that helps you form hypotheses, but also educates your team about the balance of delight and margin?
- Do you have surveys, indicating the demographics of your customers, why they leave, as well as a Net Promoter Score? Do you have the ability to gather “sample data” from customers to build a trend line and identify mistakes quickly?
- Do you have ongoing focus groups, one-on-ones and usability sessions with customers? Does your team meet and talk with customers to develop the “voice of the customer” within your organization?
- Do you have an A/B test capability that allows you to measure the trade-off between delight and margin, and develop your team’s intuition to form stronger hypotheses in the future?
- Based on consumer insights and learnings, do you have a product strategy that defines your hypotheses about what you hope will fulfill the trifecta of delighting customers in hard-to-copy, margin-enhancing ways?
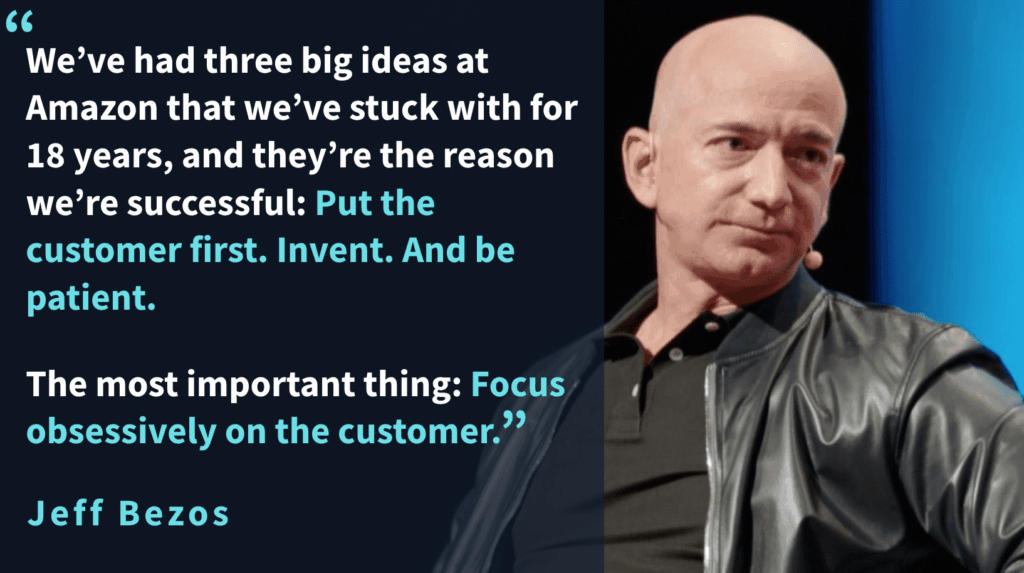
There’s one more requirement: Patience. Most companies suck at the beginning and becoming a great company takes about twenty years. Jeff Bezos, the CEO of Amazon, nicely summarizes their approach:
Behavior Can Be Designed.
Download our course on Product Psychology.
Your email address is safe. I don't do the spam thing. Unsubscribe anytime. Privacy Policy.
Nir’s Note: This guest post is by Gibson Biddle, former VP at Netflix and CPO at Chegg. Gibson is speaking at the Habit Summit in San Francisco on April 11th.
Featured photo credit: Adaptation of photo by re:publica/Gregor Fischer (CC BY-SA 2.0).
Related Articles
- Schedule Maker: a Google Sheet to Plan Your Week
- Cancel the New York Times? Good Luck Battling “Dark Patterns”
- How to Start a Career in Behavioral Design
- A Free Course on User Behavior
- User Investment: Make Your Users Do the Work
- Variable Rewards: Want To Hook Users? Drive Them Crazy
- The Hooked Model: How to Manufacture Desire in 4 Steps