Nir’s Note: In this guest post, Abhay Vardhan, discusses how to measure the strength of user habits with cohort analysis and retention rate. Abhay is a founder of Blippy.com and blogs at abhayv.com. Follow Abhay on Twitter @abhayvardhan.
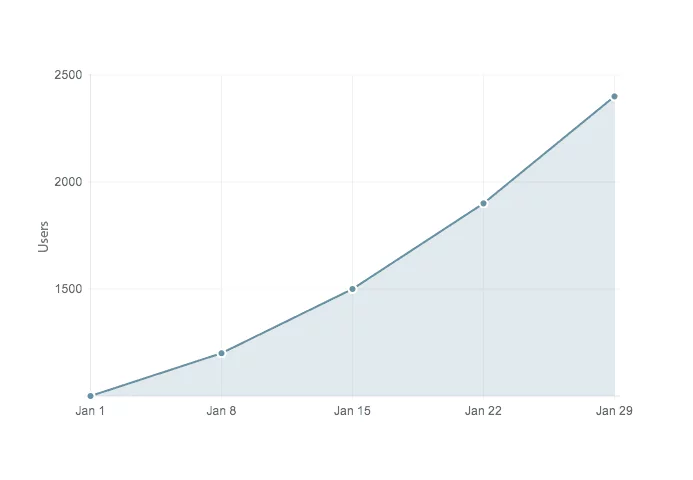
You would think PinterestForDogs is doing quite well, right? Well, it depends.
A common mistake entrepreneurs make is to focus too much on user growth. Instead, it is often more important to ask: “Is the product creating a habit so users keep coming back?” and “How do we measure the strength of such a habit?” These questions are crucial because without establishing user habits, it is impossible to sustain a healthy user base. Eventually, all user acquisition channels saturate.
I learned this the hard way with our first product, a walkie-talkie app called blip.me that allowed users to record and share audio clips. Initially, we saw good viral growth as users invited others. User retention, however, was not so great; people were excited initially but dropped off within a few weeks. So how did it end? The app was downloaded by millions, but used by few.
Given the importance of establishing a user habit, how do we track it? In my experience, the best way to do this is by measuring retention rate through cohort analysis. Let us define these terms.
Cohort Analysis
- A cohort is a group of people who share a particular characteristic over a period of time. An example is a group of users who joined on a particular day. A cohort analysis follows these users’ actions over a period of time.
Retention Rate
- The retention rate of a cohort for a period of time is the ratio of number of active users at the end of the period to the number of active users at the start of the period. The definition of an active user is usually very specific to the product. For our purposes, a user is active on a given day if he or she has visited the product on that day.
Continuing with our example, PinterestForDogs, we will measure the retention rate through cohort analysis for two cohorts of 100 users, one cohort consisting of users who joined on January 1 and another who joined a week later on January 8.
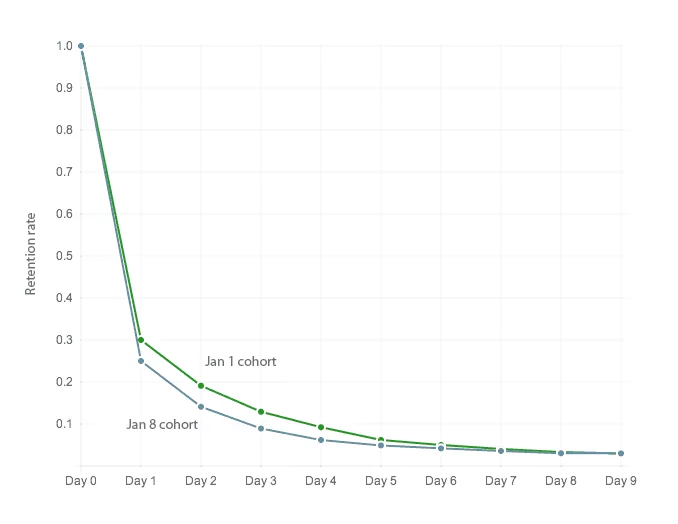
As you can see from the example, the retention rate decays with time and eventually plateaus. Although the January 1 cohort seems to have higher retention, both cohorts experience a sharp drop off and settle to a retention rate of 0.03 (3%). This final level consists of users that have become hooked: they have established a habit pattern to keep coming back to the product. These are your most interesting users.
How is cohort analysis helpful?
- Critical data does not get thrown off by external events. If you just look at user growth, a mention by a blog may cause a huge spike in user sign-ups but pre-existing cohorts would not be affected much.
- Cohorts give you actionable data. Why is the user retention weak? Could it be the onboarding? Do you need reminders to establish a consumption habit? By watching the cohort closely, you can understand how users are acting.
- Cohort analysis naturally leads you to an intense focus on the consumer. If you are looking at a cohort of 100 users, these are real people. The more you analyze the cohort, the better you will understand them.
- Cohort analysis is an objective view of progress. It’s easy to drink your own kool-aid when you are experiencing heady user growth. Keeping a close eye on cohorts forces you to continue asking the right questions.
What retention rate numbers should you expect?
Naturally, retention rates vary by industry. An e-commerce application that is able to monetize users well can probably live with much lower retention rate than a free social networking app that needs millions of active users to be profitable. The following numbers are tailored to mobile or web apps in the social networking/sharing space.
In our space, 4 weeks after the cohort join date should be when user engagement plateaus, which is the ideal time to measure retention rate through cohort analysis. Generally a retention rate of more than 20% is excellent. To compare yourself to two successful companies in this space, Twitter and Pinterest, you can look at the analysis by RJMetrics (reproduced with permission below).

The graph above is a cohort analysis that analyzes cohorts in time intervals of weeks instead of days and an active user is someone who has published at least once a week. We can see that by this measure, the retention rate for Twitter plateaus around 22%.
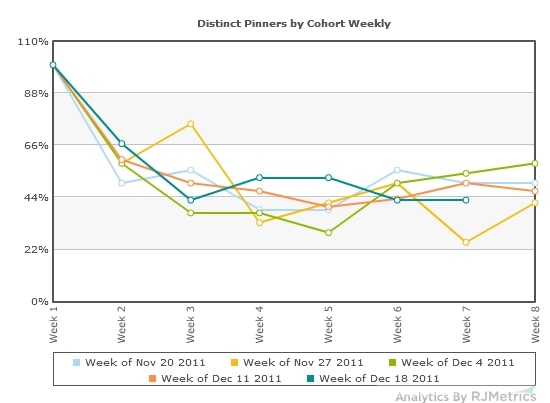
On the other hand, the retention rate for Pinterest settles at an astonishing 45%!
If your retention rates are less than 5% after 4 weeks, it’s likely that your product has not establish a user habit. With some cohort analysis, you may be able to determine why. Is it something that users really want? Are your users getting confused? If we look at the retention rate of PinterestForDogs, we see that it is only 3%. This implies that it is unlikely to succeed, even though the first graph of user growth looked great.
Cohort analysis asks tough questions. But, the sooner you ask them the better your startup will be.
Summing up
To succeed, a product has to create a lasting habit so that users keep coming back. Without habits, even if there is good user acquisition, it is hard to establish a growing base of active users. Simple metrics, such as retention rate, can be applied to new users to determine the strength of the habit. Cohort analysis can lead to valuable insights crucial to the success of any habit-forming product.
Many thanks for Nir Eyal, David King, Tim Courrejou, and Sameer Shariff for comments on earlier drafts of this post.
Note: This guest essay was written by Abhay Vardham.
Related Articles
- Schedule Maker: a Google Sheet to Plan Your Week
- Cancel the New York Times? Good Luck Battling “Dark Patterns”
- How to Start a Career in Behavioral Design
- A Free Course on User Behavior
- User Investment: Make Your Users Do the Work
- Variable Rewards: Want To Hook Users? Drive Them Crazy
- The Hooked Model: How to Manufacture Desire in 4 Steps